The Dow Jones Industrial Average (DJIA), often simply called “the Dow,” is one of the most widely recognized stock market indices in the world. Here’s a detailed look at what it is, how it works, its history, its strengths and weaknesses, and how to track it:
What is the DJIA?
- A Price-Weighted Index: The Dow is a price-weighted average of 30 large, publicly owned companies based in the United States. This means that stocks with higher share prices have a greater influence on the index’s value than those with lower share prices. (This is a key difference from market-cap weighted indices like the S&P 500 – more on that later).
- Represents a Snapshot of the Economy: While the name “Industrial Average” might suggest it only represents industrial companies, it’s evolved to include companies from various sectors, aiming to reflect the overall health of the U.S. economy.
- A Historical Benchmark: It’s the oldest continuing U.S. market index, providing a long-term perspective on market performance.
The 30 Companies (as of November 2025)
Here’s the current list (subject to change – companies are added and removed periodically):
(Note: This list is ordered alphabetically by company name.)
- 3M Co (MMM)
- Amazon.com Inc (AMZN)
- American Express Co (AXP)
- Amgen Inc (AMGN)
- Apple Inc (AAPL)
- Boeing Co (BA)
- Caterpillar Inc (CAT)
- Chevron Corp (CVX)
- Cisco Systems Inc (CSCO)
- Coca-Cola Co (KO)
- Goldman Sachs Group Inc (GS)
- Home Depot Inc (HD)
- Honeywell International Inc (HON)
- International Business Machines Corp (IBM)
- Johnson & Johnson (JNJ)
- JPMorgan Chase & Co (JPM)
- McDonald’s Corp (MCD)
- Merck & Co Inc (MRK)
- Microsoft Corp (MSFT)
- Nike Inc (NKE)
- NVIDIA Corp (NVDA)
- Procter & Gamble Co (PG)
- Salesforce Inc (CRM)
- Sherwin-Williams Co (SHW)
- Travelers Companies Inc (TRV)
- UnitedHealth Group Inc (UNH)
- Verizon Communications Inc (VZ)
- Visa Inc (V)
- Walmart Inc (WMT)
- Walt Disney Co (DIS)
How is the DJIA Calculated?
The calculation is relatively simple:
- Sum of Prices: Add up the stock prices of all 30 companies.
- Divide by the Dow Divisor: Divide the sum by a number called the “Dow Divisor.” This divisor is not 30. It’s a number adjusted over time to account for stock splits, dividends, and other corporate actions that would otherwise artificially change the index’s value. Currently, the Dow Divisor is a small number (around 0.14733).
- The Result: The result is the Dow Jones Industrial Average.
Example (Simplified)
Let’s say the 30 stocks have an average price of $150. The Dow would be: $150 * 30 / 0.14733 = approximately 30,630. (The actual Dow is different due to real-time price fluctuations and the divisor).
History of the DJIA
- 1896: Created by Charles Dow, co-founder of Dow Jones & Company, and Edward Jones. It initially included only 12 companies, primarily in the industrial sector (railroads, cotton, gas, sugar, tobacco, and leather).
- Evolution: The composition of the Dow has changed significantly over the years, reflecting shifts in the U.S. economy. Companies have been added and removed to maintain relevance.
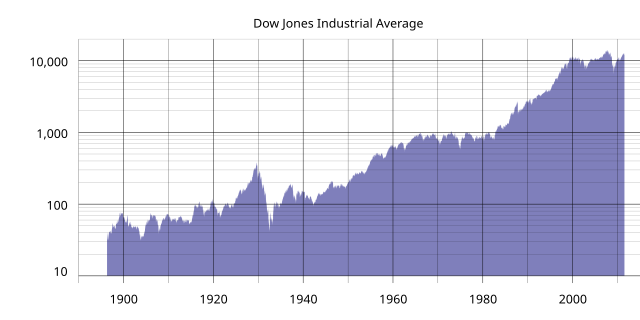
- Major Milestones: The Dow has reached numerous milestones, including breaking 1,000 in 1973, 10,000 in 1999, 20,000 in 2017, and 30,000 in 2020.
Strengths of the DJIA
- Historical Significance: Provides a long-term perspective on market trends.
- Simplicity: Easy to understand and calculate (though the divisor is a bit opaque).
- Media Attention: Widely reported in the news, making it a familiar benchmark for investors.
- Blue-Chip Representation: Includes well-established, financially sound companies.
Weaknesses of the DJIA
- Limited Scope: Only 30 companies, which is a small sample of the overall U.S. stock market.
- Price-Weighting: This is its biggest flaw. A stock with a high price, even if its market capitalization is smaller than another company, will have a greater impact on the index. This can lead to distortions.
- Not Representative of the Entire Economy: While it aims to be, it doesn’t fully capture the diversity of the U.S. economy. Technology is heavily represented, but other sectors may be underrepresented.
- Divisor Adjustments: The divisor adjustments, while necessary, can make it harder to interpret the index’s historical performance.
How to Track the DJIA
- Financial Websites: Major financial websites like Yahoo Finance, Google Finance, Bloomberg, and MarketWatch provide real-time Dow Jones Industrial Average quotes.
- News Outlets: Business news channels (CNBC, Fox Business) and newspapers (Wall Street Journal, Financial Times) regularly report on the Dow.
- Brokerage Accounts: Your brokerage account will typically display the Dow’s current value.
- Dow Jones Website: The official Dow Jones website (https://www.dowjones.com/) provides information about the index.
DJIA vs. Other Indices (S&P 500 & Nasdaq Composite)
| Feature | Dow Jones Industrial Average (DJIA) | S&P 500 | Nasdaq Composite |
|---|---|---|---|
| Number of Companies | 30 | 500 | Over 3,000 |
| Weighting Method | Price-Weighted | Market-Cap Weighted | Market-Cap Weighted |
| Sector Focus | Broad, but historically industrial | Broad, representing the U.S. economy | Heavily weighted towards technology |
| Represents | Large, well-established companies | Large-cap U.S. companies | All companies listed on the Nasdaq exchange |
| Generally Considered | A snapshot of market sentiment | A more comprehensive measure of the U.S. stock market | A gauge of the technology sector |
In conclusion
The Dow Jones Industrial Average is a valuable, though imperfect, indicator of the U.S. stock market’s performance. While its price-weighted methodology and limited scope have drawbacks, its historical significance and widespread recognition make it a crucial benchmark for investors and economists alike. It’s best used in conjunction with other indices, like the S&P 500 and Nasdaq Composite, to get a more complete picture of the market.
Disclaimer: I cannot provide financial advice. This information is for general knowledge and educational purposes only. Always consult with a qualified financial advisor before making any investment decisions.